Every cell contains an extraordinary amount of biological information. Yet a cell's identity is not determined by DNA alone. It also depends on which genes are active, how their activity changes, and how the resulting molecules influence cellular behavior. Understanding this process has become one of the central goals of modern biotechnology. The scientific journey begins with a fundamental question: how does a cell turn genetic information into biological function?
What Is Gene Expression, and Why Does It Matter?
Gene expression is the process through which information encoded in a gene contributes to a functional molecular product. For protein-coding genes, the process commonly begins with transcription, when a DNA sequence is copied into RNA. The resulting messenger RNA can subsequently be translated by ribosomes to produce a protein.
Proteins perform many essential cellular functions. They catalyze chemical reactions, transport molecules, transmit signals, provide structural support and regulate the activity of other genes. Some genes instead produce functional non-coding RNAs, which can participate directly in cellular regulation.
Although most cells within an individual share essentially the same genome, they do not express the same genes at the same levels. For example, pancreatic beta cells express the insulin gene as part of their specialized function, while certain immune cells express receptors and signaling molecules required to recognize pathogens.
This selective use of genetic information helps explain how cells develop distinct identities and respond differently to changing environments. Gene expression is therefore a critical connection between an organism's genetic information and its observable biology.
Fundamental principle: DNA provides genetic information, RNA reflects important aspects of gene activity, and proteins carry out many cellular functions. Expression is regulated and dynamic, so the presence of a gene does not mean it is equally active in every cell.
How Cells Control Gene Activity
Gene expression is not a fixed on-or-off property. It is controlled at multiple molecular levels, allowing a cell to adjust its behavior in response to developmental programs, chemical signals, nutrients and environmental stress.
Transcription factors are regulatory proteins that recognize particular DNA sequences and influence transcription. Chromatin structure also matters: DNA associated with histone proteins may be more or less accessible to the molecular machinery needed to express a gene.
Regulation continues after transcription. RNA molecules may be processed through alternative splicing, transported to specific cellular locations, translated at different rates or degraded. Protein abundance is further influenced by translation efficiency and protein turnover.
Consider an immune cell exposed to an inflammatory signal. Receptor activation can initiate signaling pathways that change transcription factor activity, leading to increased expression of selected cytokines and other response genes. As the stimulus disappears, regulatory feedback may reduce the response.
Expression also varies naturally between cells. Some of this variation reflects meaningful biological states; some results from the probabilistic behavior of molecular processes. This variation raises an important experimental question: how can scientists reliably observe changes in gene activity?
How Scientists Measure Gene Expression
Because RNA is produced during transcription, measuring RNA abundance provides a useful way to investigate gene expression. Researchers can isolate RNA from cultured cells, tissue specimens or other biological samples and then analyze selected transcripts or much larger portions of the transcriptome.
Reverse-transcription quantitative PCR (RT-qPCR) is a common method for measuring selected RNA targets. RNA is converted into complementary DNA, which is amplified and quantified through a fluorescence-based reaction. It is particularly useful for targeted experiments where the genes of interest are already known.
RNA sequencing (RNA-seq) takes a broader approach. Instead of measuring only a few selected genes, sequencing can capture expression information across thousands of transcripts. This allows researchers to explore unexpected molecular responses and discover potential biomarkers.
Protein-focused methods such as Western blotting, immunofluorescence, flow cytometry and mass spectrometry provide complementary evidence. These measurements are important because RNA abundance does not always predict corresponding protein abundance.
| Method | What It Measures | Typical Research Use |
|---|---|---|
| RT-qPCR | Selected RNA targets after reverse transcription | Validating expression changes in known genes |
| Bulk RNA-seq | Transcript abundance averaged across sampled cells | Comparing transcriptomes between conditions |
| Single-cell RNA-seq | Captured RNA from individual cells | Investigating cellular heterogeneity |
| Flow cytometry | Cell-associated markers, often proteins | Identifying and quantifying cell populations |
| Proteomics | Proteins and, depending on method, their modifications | Studying molecular functions and pathways |
These methods answer related but different questions. Choosing among them depends on the biological hypothesis, the number of targets, available material, and whether differences between individual cells are important.
From Average Gene Expression to Individual Cells
Traditional bulk RNA-seq provides an aggregate expression profile for all the cells included in a biological sample. This is extremely valuable, but it can conceal differences between the underlying cell populations.
Imagine a tissue containing epithelial cells, fibroblasts and immune cells. A bulk measurement might show increased expression of an inflammatory gene, but it may not reveal which population produced the signal. A change in the proportions of cell types can also alter the average expression profile, even when expression within individual cell types remains unchanged.
Single-cell RNA sequencing addresses this challenge by associating captured RNA molecules with individual cells. Instead of producing one expression profile for the whole sample, it generates many cellular profiles that can be compared.
This makes it possible to investigate distinct cell populations, transitional states and rare cell types that might be difficult to recognize using bulk measurements alone. However, single-cell data remain incomplete samples of cellular RNA and are affected by technical noise, so computational analysis is essential.
Illustrative example: If a sample contains two cell populations with very different expression profiles, the average may resemble neither population. Single-cell analysis can reveal the underlying cellular diversity instead.
How Single-Cell Sequencing Generates Data
A typical single-cell RNA-seq experiment begins with biological sample preparation. Tissue may be dissociated into a suspension of cells, or nuclei may be isolated when whole-cell recovery is difficult or undesirable. Sample quality matters because damaged or stressed cells can introduce misleading transcriptional signals.
Cells or nuclei are then partitioned using technologies such as microfluidic droplets, microwells or cell sorting. Many workflows attach a cellular barcode to captured RNA-derived molecules, making it possible to associate sequencing reads with their cell of origin. Unique molecular identifiers (UMIs), when used, help distinguish originally captured RNA molecules from amplification copies.
RNA is typically reverse-transcribed to cDNA, which is processed into sequencing libraries. A next-generation sequencing instrument reads the resulting DNA fragments, producing large collections of short sequence reads. These reads must then be associated with cellular barcodes and reference transcripts or genomic sequences.
The result is commonly a gene-by-cell count matrix. Each row represents a gene, each column represents a cell or cellular barcode, and each value records the number of captured molecules assigned to that gene and cell under the chosen protocol.
The matrix does not represent a perfect census of every RNA molecule that existed in the original cells. Capture efficiency, sequencing depth, RNA integrity and library preparation influence what is detected. Understanding these limitations is necessary before biological interpretation begins.
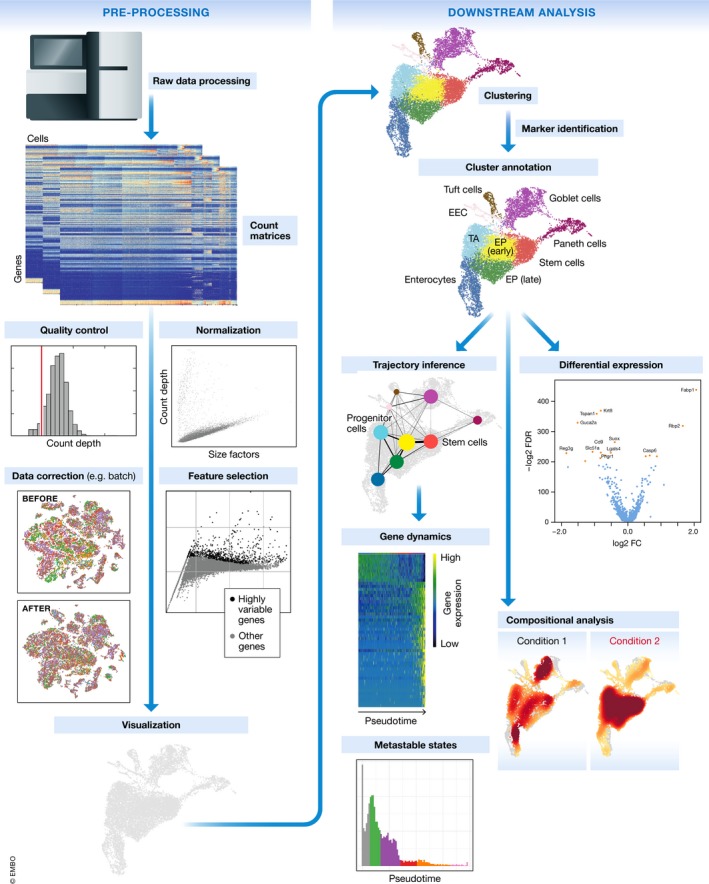
Turning Sequencing Reads Into Reliable Information
Once the gene-by-cell matrix has been generated, researchers must decide which observations are reliable enough for further analysis. This stage is known as quality control. It is a critical bridge between experimental measurement and biological interpretation.
Common quality-control measures include the number of genes detected per cell, the total molecular count and the proportion of reads or counts assigned to mitochondrial genes. Unusually low values may indicate poor capture, while some unusually high-count profiles may result from two cells captured together, a phenomenon known as a doublet.
These metrics require careful interpretation. For example, high mitochondrial expression may indicate damaged cells in some contexts, but it can also have biological explanations. Rigid thresholds applied without considering cell type and experiment may remove genuine populations.
After quality control, normalization methods help account for differences in capture efficiency and sequencing depth. Analysts then select informative genes and may correct technical differences between experimental batches. The goal is to preserve biologically meaningful differences without allowing technical artifacts to dominate the analysis.
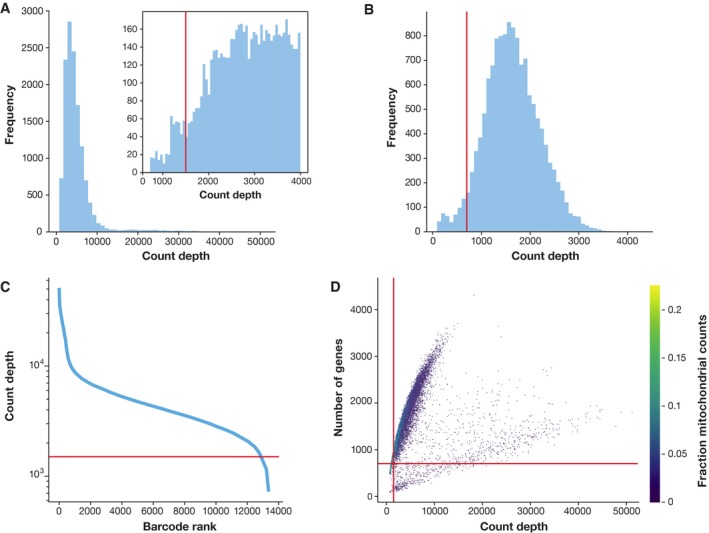
High-quality analysis does not eliminate every source of uncertainty. Rather, it makes these sources visible and improves the reliability of subsequent comparisons. With the data prepared, scientists can begin asking which kinds of cells are present.
Discovering Cell Types, States and Biological Patterns
A single-cell expression dataset often contains thousands of genes measured across many cells. Visualizing this information directly is difficult because it exists in a high-dimensional mathematical space. Computational methods help summarize the most informative patterns.
Principal component analysis and methods such as UMAP can provide lower-dimensional representations of cellular expression profiles. Cells with similar transcriptional patterns may appear near one another, while those with more distinct profiles may occupy different regions of the plot.
Clustering algorithms identify groups of cells with related profiles. Researchers then examine marker genes and compare the clusters with established biological knowledge to propose cell-type identities. For example, expression of CD3-related genes may support a T-cell annotation, while epithelial keratins can help identify epithelial populations.
These labels require validation. A cluster is a computational grouping, not automatic proof of a unique biological cell type. Differences may reflect activation, maturation, the cell cycle or experimental effects. Likewise, distances in a two-dimensional UMAP should not automatically be interpreted as precise biological distances.
Researchers can then investigate expression differences between conditions, infer possible developmental trajectories or analyze changes within individual cellular populations. Statistical comparisons must consider biological replicates and experimental design to avoid treating thousands of cells from one sample as thousands of independent biological experiments.
Biological interpretation: A cluster with elevated interferon-response genes may represent an activated cellular state rather than a newly discovered cell type. Experimental context is essential.
Connecting Genes to Biological Function
Identifying differences in gene expression is only the beginning. Scientists also want to understand what these differences mean biologically. This is where knowledge organization systems, pathway databases and biomedical ontologies become particularly useful.
Gene Ontology (GO) provides structured terminology describing biological processes, molecular functions and cellular components. A gene product can be associated with ontology terms through evidence-based annotations, allowing scientists to analyze groups of genes using consistent biological concepts.
Suppose an experiment identifies a collection of genes with increased expression in activated immune cells. Enrichment analysis might reveal that terms associated with cytokine signaling, antigen processing or immune regulation are overrepresented among these genes. This gives researchers a more interpretable view of the molecular changes than a gene list alone.
Ontologies also help integrate results across datasets. Standardized concepts allow the same biological entities or processes to be described consistently, even when studies use different platforms or produce data in different formats. Knowledge graphs can connect genes, proteins, pathways, diseases and scientific evidence.
However, pathway or ontology enrichment is not proof that a biological process has been causally activated. Results depend on the annotation database, background gene set, statistical method and quality of the underlying expression data. Functional interpretations should generate hypotheses for subsequent experimental testing.
| Information Layer | Example | Research Value |
|---|---|---|
| Gene expression | Increased STAT1 transcript abundance | Identifies a molecular observation |
| Pathway analysis | Interferon signaling | Provides functional context |
| Gene Ontology | Immune-related biological process terms | Uses standardized functional vocabulary |
| Knowledge graph | Gene–pathway–disease relationships | Connects multiple evidence sources |
In this way, bioinformatics moves beyond counting RNA molecules and toward structured biological explanation. The next challenge is to bring together several molecular layers to understand cells even more completely.
From Transcriptomics to Multiomics and Spatial Biology
RNA sequencing provides valuable information about transcriptional activity, but the transcriptome represents only one layer of cellular biology. Genetic variants, chromatin accessibility, proteins, metabolites and molecular interactions also influence how cells behave.
Single-cell multiomics approaches combine measurements from different molecular layers. Depending on the technology, investigators may measure RNA expression together with surface proteins, chromatin accessibility or other features. These complementary measurements can improve cellular characterization and illuminate relationships between regulation and cellular state.
Spatial transcriptomics addresses another important limitation. Conventional dissociation-based single-cell experiments often lose information about the original location of cells in a tissue. Spatial methods retain or reconstruct information about where molecular signals occur, although their spatial resolution and transcript coverage vary by platform.
This matters in complex tissues such as the brain or a tumor. Two cell populations may express similar genes but occupy distinct anatomical regions and interact with different neighboring cells. Combining cellular expression profiles with spatial context can reveal relationships that neither method captures fully alone.

Modern computational methods, including machine learning, can assist with multimodal integration, cellular classification and the identification of complex patterns. Yet more data do not automatically guarantee more reliable conclusions. Successful analysis still requires appropriate experimental controls, independent validation and careful consideration of model bias.
How Gene Expression Research Drives Modern Biotechnology
The ability to measure gene expression at cellular resolution has expanded the questions that researchers can ask about development, disease, immunity and therapeutic response. Rather than assuming that a tissue behaves as a uniform population, scientists can investigate the molecular activities of its individual cellular components.
In cancer research, single-cell transcriptomics is used to characterize tumor cells, stromal populations and infiltrating immune cells. These analyses may identify heterogeneous transcriptional states and potential mechanisms associated with therapy resistance. Findings can guide biomarker research, although clinical use requires independent validation and appropriate regulatory evaluation.
In immunology, researchers can examine how different immune populations respond to infections, inflammation and experimental treatments. In regenerative biology, expression trajectories can help investigate differentiation and cellular development. In drug discovery, transcriptomic profiling can reveal how candidate compounds influence particular cell populations and biological pathways.
These discoveries rely on an interconnected set of laboratory and computational tools: reliable sample preparation, RNA isolation, sequencing technologies, targeted validation assays, appropriate statistical analysis and well-curated biological reference data. Ontologies and knowledge graphs provide an additional bridge, connecting experimental measurements with established biological terminology and evidence.
The broader lesson is that biotechnology does not advance through a single technology in isolation. Progress arises when fundamental biology, experimental measurement, computational methods and scientific interpretation support one another.
The central scientific connection: Gene expression begins with the regulated use of genetic information inside a cell. Molecular techniques make that activity measurable. Sequencing transforms the measurements into large datasets. Bioinformatics and biomedical ontologies help translate those datasets into meaningful biological hypotheses. Modern biotechnology uses that understanding to explore disease, develop research tools and guide new discoveries.
Scientific References
1. Luecken MD, Theis FJ. Current best practices in single-cell RNA-seq analysis: a tutorial. Molecular Systems Biology. 2019;15:e8746. Read publication ↗
2. Li W et al. Single-Cell and Spatial Multiomics: Applications for Diseases. MedComm. 2025;6:e70553. Read publication ↗
3. Single-cell sequencing: promises and challenges for human genetics. An educational review of single-cell experimental and analytical methods. Read publication ↗
4. Single-Cell Multiomics: Multiple Measurements from Single Cells. A review of multimodal single-cell approaches. Read publication ↗
5. Gene Ontology Consortium. Gene Ontology: biological processes, molecular functions and cellular components. Explore resource ↗
Editorial note: The included published figures retain their original visual content and are attributed to their source articles. Scientific information is provided for research education.