Why the Location of a Cell Matters
Multicellular organisms are built from specialized cells organized into tissues and organs. Although many cells share essentially the same genome, they perform different functions depending on their developmental history, gene expression and surrounding environment. Tissue organization provides an additional layer of biological regulation.
Consider the human intestine. Epithelial cells lining the intestinal surface are arranged into characteristic structures containing distinct functional regions. Stem and progenitor cells are associated with intestinal crypts, while differentiated epithelial cells occupy other positions. The molecular signals experienced by each cell depend partly on this anatomical organization.
Similar spatial relationships influence the immune system. Immune cells migrate through tissues and respond to signals from nearby cells. Cytokines, cell-surface receptors and extracellular matrix molecules can contribute to localized signaling environments. A cell may therefore behave differently depending on its neighbors, even when its genetic identity remains unchanged.
These relationships are often described as the tissue microenvironment. A microenvironment includes nearby cells, extracellular structures and biochemical signals that influence local cellular functions. Understanding this context is important in developmental biology, immunology, neuroscience and cancer research.
The fundamental challenge is that cells operate simultaneously at molecular and anatomical scales. Scientists need methods that connect the activity of thousands of genes with the physical positions of cells inside tissues.
Gene Expression Reveals Cellular Identity
Gene expression is the process by which genetic information contributes to functional RNA molecules and proteins. In protein-coding genes, transcription produces RNA that can be processed and translated into proteins. The collection of RNA molecules present in a cell is known as its transcriptome.
Measuring messenger RNA abundance provides a useful view of cellular activity. For example, immune cells undergoing activation may increase the expression of genes involved in signaling, migration and inflammatory responses. Neurons express molecular machinery involved in neuronal signaling and neurotransmission.
Single-cell RNA sequencing has made it possible to investigate these expression programs in individual cells. However, many conventional single-cell workflows require the tissue to be dissociated into separate cells or nuclei. The expression profiles can be preserved, but the original spatial relationships are often lost.
This creates a practical limitation. Researchers may know that a tissue contains fibroblasts, macrophages and epithelial cells, but not exactly where those populations are located or how they are arranged. Spatial transcriptomics addresses this gap by associating RNA measurements with positions within a tissue.
Core idea: Single-cell transcriptomics asks which genes are active in individual cells. Spatial transcriptomics adds the question of where those expression patterns occur within the tissue.
How Scientists Measure Gene Activity in Place
The purpose of spatial transcriptomics is to associate gene expression measurements with known positions in a biological specimen. Most approaches analyze prepared tissue sections rather than monitoring the same living tissue continuously. This distinction matters: spatial transcriptomics commonly provides a molecular snapshot of tissue organization.
One broad technological strategy uses microscopic imaging to identify RNA molecules directly within cells or tissue sections. Fluorescent probes can recognize selected RNA sequences, while repeated imaging cycles allow many targets to be distinguished. In situ sequencing methods use localized molecular reactions to read or decode sequence information within the specimen.
Another strategy captures RNA at spatially indexed positions on a specialized surface. Each capture location is associated with a molecular barcode. After RNA capture and library preparation, next-generation sequencing generates reads that can be assigned to positions on the tissue.
These approaches have different strengths. Imaging-based techniques can provide high spatial resolution for selected gene panels. Sequencing-based techniques often support broader transcript coverage, although sensitivity and resolution depend on the particular platform.
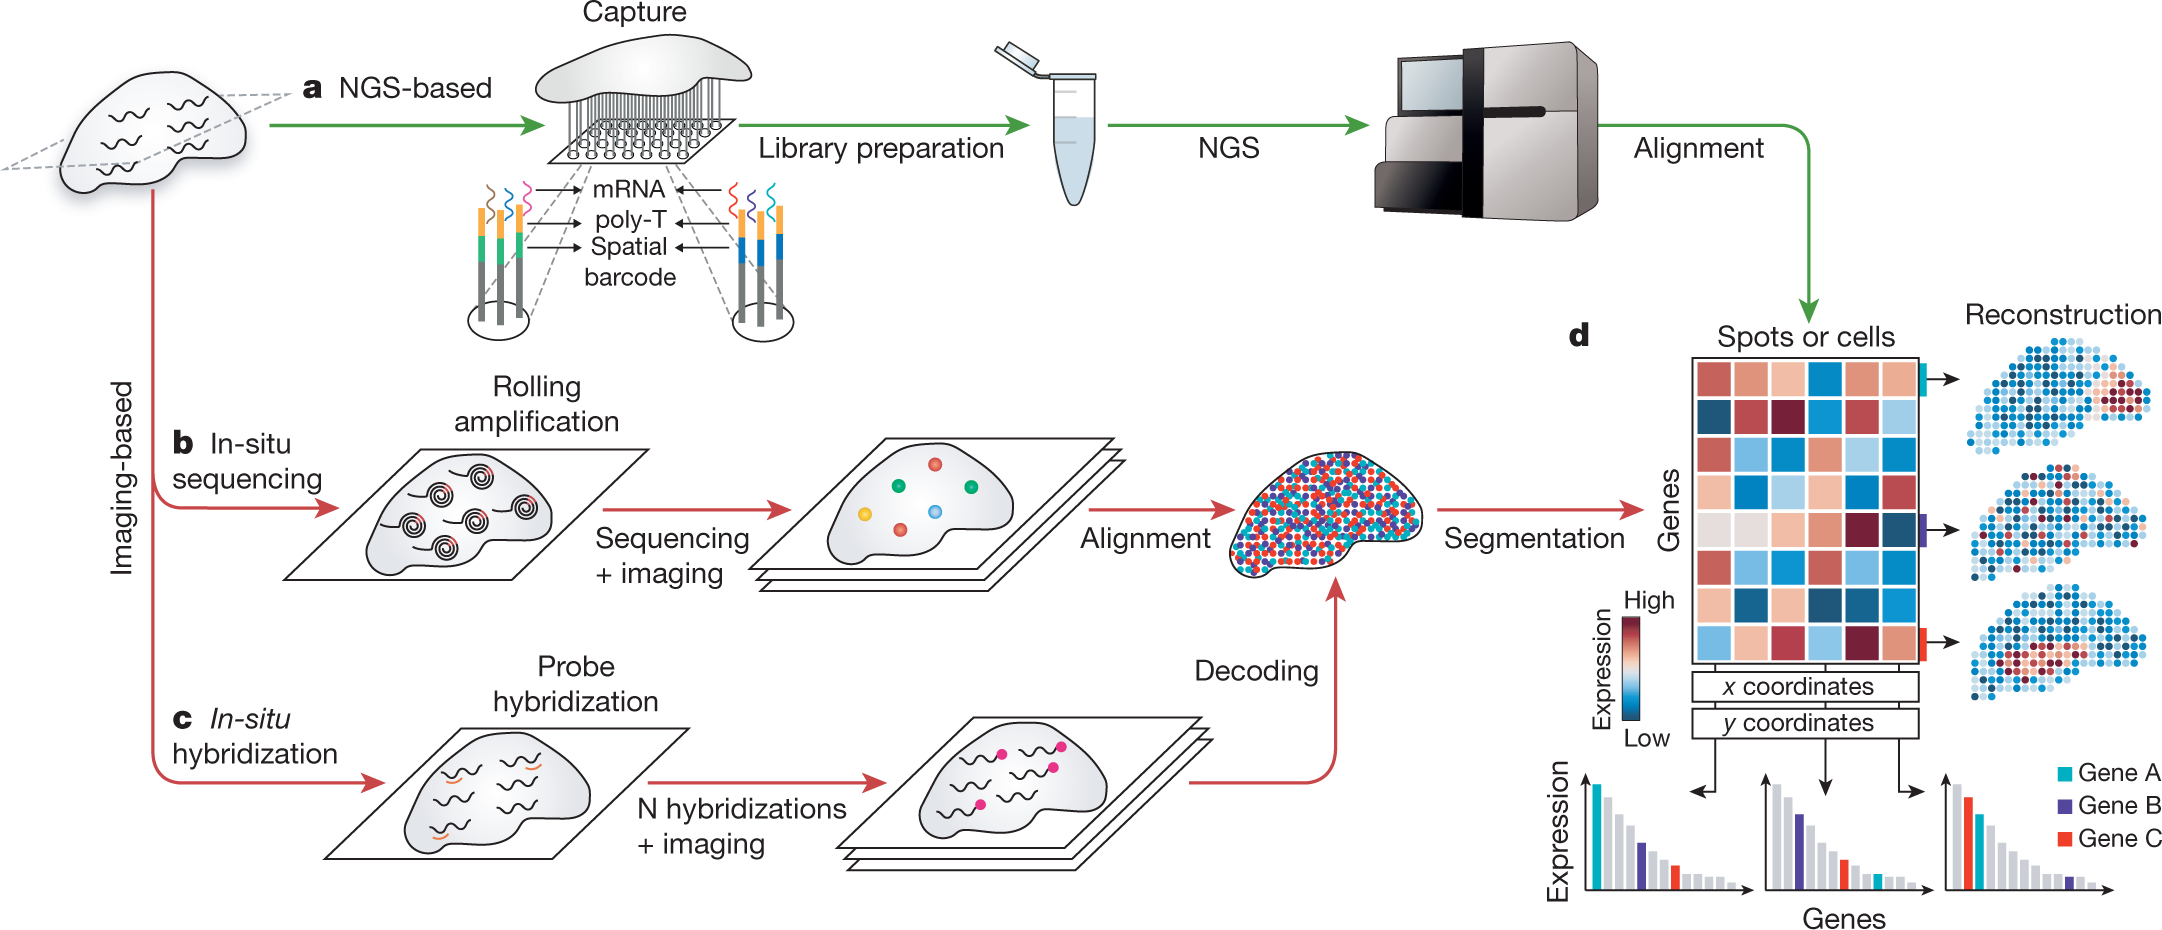
Method selection depends on the scientific question. A researcher investigating broad tissue organization may prioritize coverage of many transcripts, while a study of local cellular interactions may require finer spatial resolution. No single platform is optimal for every experiment.
From Tissue Sections to Molecular Maps
A spatial transcriptomics experiment begins with a tissue specimen and a clear biological question. Tissue preservation, section thickness, morphology and RNA integrity can affect the resulting data. Some technologies are designed for fresh-frozen material, while others support formalin-fixed, paraffin-embedded tissue using appropriate assay chemistries.
The specimen is prepared for a compatible capture or imaging system. Histological staining may reveal anatomical structures, allowing scientists to compare gene expression with visible tissue morphology. Accurate alignment between the molecular data and image coordinates is essential.
In sequencing-based systems, RNA molecules are typically converted into complementary DNA before library amplification and sequencing. Spatial barcodes preserve information about where RNA was originally captured. Computational processing later reconstructs an expression profile for each measured location.
In imaging-based workflows, multiple rounds of fluorescence imaging may be used to distinguish different RNA targets. Image processing detects signals, decodes molecular identities and assigns transcript positions. Additional image analysis may estimate cell boundaries and associate RNA molecules with individual cells.
| Approach | Principal Measurement | Strength | Consideration |
|---|---|---|---|
| Spatial capture sequencing | RNA associated with spatial barcodes | Broad gene-expression profiling | Capture regions may contain multiple cells |
| Imaging-based RNA detection | Localized fluorescent RNA signals | Fine spatial localization | Often limited to defined gene panels |
| In situ sequencing | Sequence-derived signals at tissue locations | Localized transcript identification | Assay-specific sensitivity and multiplexing |
| Region-based profiling | Expression from selected tissue regions | Targeted analysis of anatomical areas | Limited resolution within each region |
The resulting data combine expression measurements and spatial coordinates. The experimental challenge now becomes computational: how can millions of molecular observations be assembled into reliable biological information?
How Spatial Technologies Generate Data
Spatial transcriptomics datasets generally contain two complementary forms of information: molecular measurements and anatomical positions. Depending on the platform, these may be represented as gene expression counts for capture spots, transcript coordinates, cell-level measurements or profiles from selected tissue regions.
In a sequencing-based experiment, raw reads are processed to identify molecular barcodes and assign captured transcripts to genes. The output often includes a gene-by-location count matrix and a mapping between each location and its physical position in the specimen.
Imaging-based experiments can produce a more detailed molecular point cloud. Each detected RNA molecule may be associated with a gene identity and two-dimensional spatial coordinates. When cell segmentation is available, these molecules may be aggregated into cellular expression profiles.
Tissue images, segmentation masks, spatial coordinates and expression tables must remain correctly aligned. Errors in this alignment can cause expression signals to appear in the wrong anatomical region. For example, an incorrect image transformation might shift a group of immune-associated transcripts from a stromal region toward neighboring epithelial cells.
Thus, data generation is not complete when the sequencer or microscope finishes its task. Molecular identification, coordinate reconstruction and data organization form an essential part of the experimental measurement.
Turning Spatial Data Into Reliable Evidence
Spatial datasets contain technical variation arising from tissue preparation, RNA capture, sequencing or imaging conditions. Bioinformatics analysis begins by examining the quality of these measurements before attempting biological interpretation.
Sequencing-based quality control may consider the number of transcripts and genes detected per location, sequencing depth and tissue coverage. Imaging-based methods may additionally evaluate signal detection, background fluorescence, transcript decoding and cell segmentation. Spatial patterns can reveal technical artifacts not readily apparent in ordinary expression tables.
Normalization is often needed because different locations have different numbers of measured RNA molecules. However, normalization must be applied carefully. A dense tissue region may genuinely contain more cells or RNA than another region. Removing all such differences without considering biological context can obscure meaningful patterns.
Different spatial platforms also vary in sensitivity, effective resolution and gene coverage. A large comparative study published in Nature Methods benchmarked 11 sequencing-based spatial transcriptomics methods using reference tissues. The findings demonstrated the importance of standardized comparisons and tissue-specific performance evaluation.

These observations establish an important principle: a beautiful spatial gene-expression map is not necessarily an accurate map. Reliability depends on measurement quality, experimental design and the analytical decisions used to reconstruct tissue biology.
Identifying Cell Types and Spatial Neighborhoods
Once data have passed appropriate quality checks, researchers begin examining the spatial distribution of gene-expression patterns. A central goal is to associate tissue regions with biological cell types and functional states.
Cell-type identification may rely on known marker genes, reference transcriptomes and computational classification. A region enriched in epithelial keratin transcripts may support an epithelial interpretation, while immune-associated expression patterns may indicate the presence of leukocytes.
For technologies where one capture spot includes several cells, computational deconvolution can estimate the contributions of different cell types. This often uses single-cell RNA-seq reference profiles, although estimates depend on how well the reference captures the relevant populations.
Researchers can also search for spatially variable genes: genes whose expression follows a statistically meaningful anatomical pattern. Such patterns may correspond to tissue layers, developmental gradients, tumor boundaries or specialized cellular neighborhoods.
A neighborhood is not simply a cluster of nearby coordinates. Biological interpretation considers which cell types occur together, their expression states, physical organization and known molecular functions. These relationships can reveal how tissue structure supports local biological activity.
Interpretation example: A group of immune cells concentrated near a tumor boundary may indicate a distinct local immune environment. However, physical proximity alone does not prove direct cell-to-cell signaling.
From Molecular Maps to Biological Relationships
Spatial transcriptomics enables scientists to investigate how neighboring cells may influence one another. Cell communication often involves signaling molecules released or displayed by one cell and recognized by receptors associated with another.
Ligand-receptor analysis uses known molecular interaction databases and expression measurements to identify candidate signaling relationships. Adding spatial proximity information can make these predictions more biologically plausible. For example, an immune cell expressing a cytokine-associated transcript near receptor-expressing stromal cells may suggest a signaling hypothesis.
These predictions require careful interpretation. RNA abundance does not establish protein abundance, receptor activation or functional signaling. Experimental validation may require imaging of relevant proteins, perturbation studies or complementary functional measurements.
Biomedical ontologies and knowledge graphs help organize the resulting interpretations. Gene Ontology describes molecular functions, cellular components and biological processes using standardized terminology. Anatomical and cell-type ontologies can provide shared identifiers for tissue structures and cellular populations.
Knowledge graphs can then connect molecular entities, cell types, anatomical regions, pathways and literature evidence. These relationships make it easier to compare findings between research studies and generate new biological questions. Thus, semantic technologies become valuable companions to spatial omics.
| Analysis | Scientific Question | Important Limitation |
|---|---|---|
| Spatial gene expression | Where is a particular transcript detected? | Transcript capture is incomplete |
| Cell-type deconvolution | Which cell populations contribute to a region? | Depends on reference data |
| Neighborhood analysis | Which cells are located near one another? | Proximity does not establish causation |
| Ligand-receptor inference | Which signaling interactions may be present? | RNA does not prove active signaling |
| Ontology enrichment | Which biological functions are associated with a pattern? | Depends on annotations and statistics |
Revealing Disease Mechanisms Through Tissue Context
One of the most important applications of spatial transcriptomics is the study of disease within its anatomical setting. Rather than examining a bulk mixture of cells, researchers can associate gene expression with tissue compartments, lesions and localized cellular environments.
In cancer research, spatial techniques help characterize tumor cells, stromal populations and infiltrating immune cells. Researchers can investigate whether particular transcriptional states concentrate near tumor boundaries, blood vessels or regions of immune cell accumulation. These patterns can provide hypotheses about tumor progression and therapeutic response.
In neuroscience, the anatomical organization of the brain makes spatial information particularly valuable. Transcriptomic analysis can help distinguish brain regions, investigate neuronal and glial populations and examine molecular changes associated with localized pathology. Published studies have investigated expression programs near amyloid plaques in models of neurodegenerative disease.
Developmental biology provides another compelling application. During tissue formation, cellular identities and signaling programs vary along spatial gradients. Mapping RNA activity across developing tissues can help scientists understand how molecular regulation contributes to organized anatomical structures.
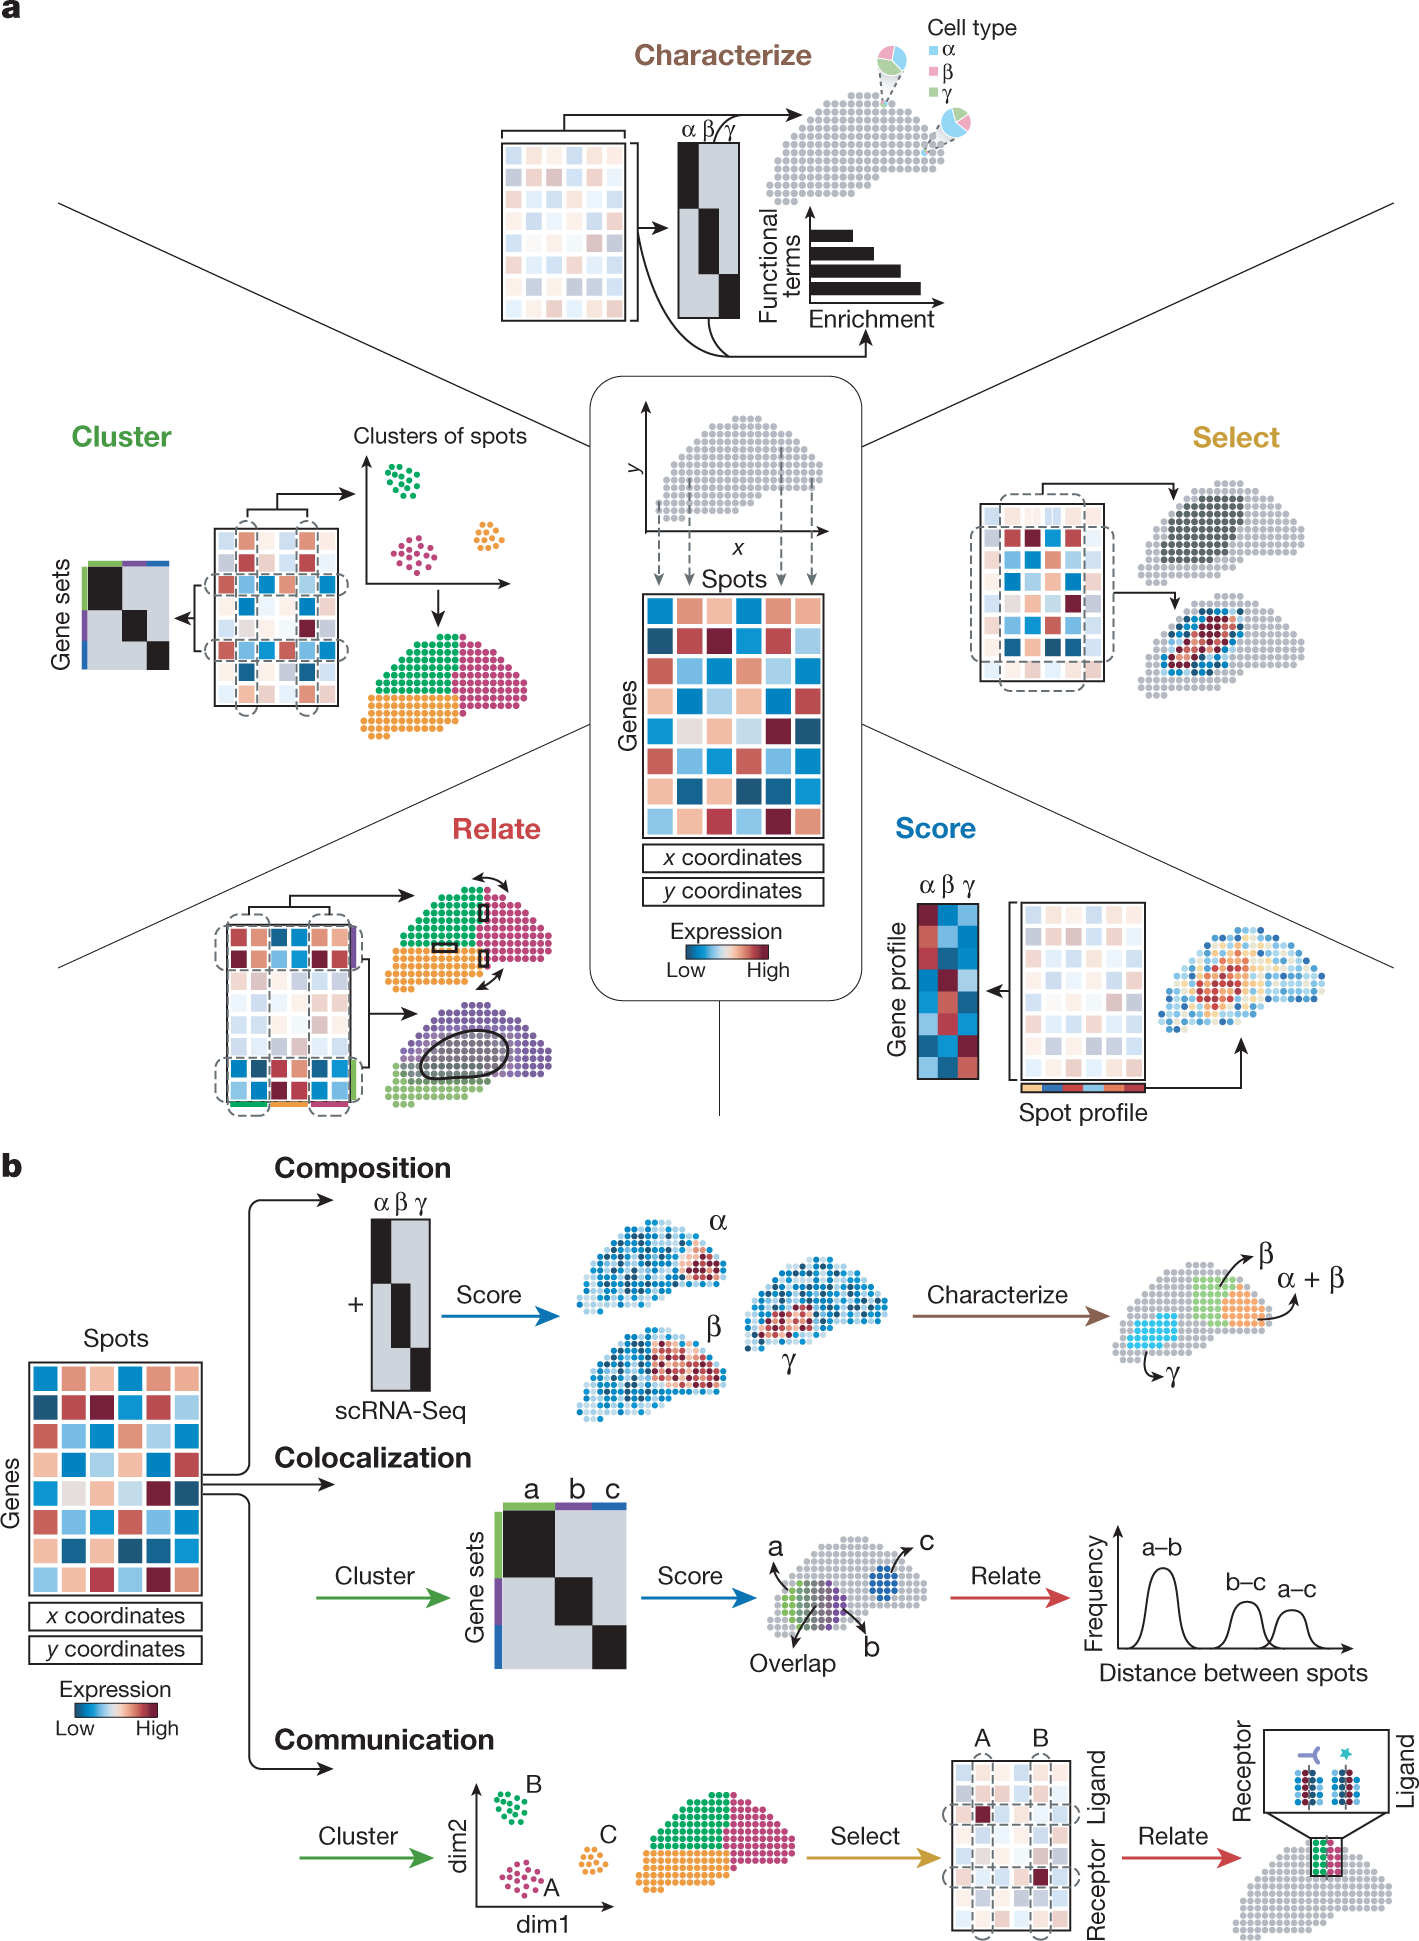
These applications demonstrate that spatial transcriptomics is more than an advanced imaging technique. It is a way to connect gene activity with anatomy and to investigate how local environments influence disease and development. Nevertheless, predictive biomarkers and clinical applications require validation beyond discovery-stage expression maps.
How Spatial Transcriptomics Advances Modern Biotechnology
Spatial transcriptomics is helping scientists rethink the way biological tissues are investigated. Traditional genomics measures genetic information, while transcriptomics reveals patterns of RNA activity. Spatial technologies connect those molecular measurements to the physical organization of cells in tissues.
This integration has implications for drug discovery, biomarker research and the investigation of disease mechanisms. For example, researchers studying an experimental therapeutic compound may investigate whether particular cell populations change their transcriptional state and whether those changes are localized within specific tissue regions. Such evidence can guide further laboratory experiments.
Spatial omics can also be combined with single-cell sequencing, proteomics, histology and advanced microscopy. Integrating these datasets creates a richer model of biological systems, although each additional modality introduces technical and analytical challenges. Computational modeling and machine learning can assist with these integrations, provided that predictions undergo suitable validation.
Knowledge representation plays a central role in making these increasingly complex datasets useful. Standardized cell-type definitions, anatomical ontologies and molecular pathway annotations help organize observations across laboratories and scientific disciplines. Knowledge graphs can connect the resulting findings with published evidence and biological reference systems.
The future of this field is not simply to produce images with more molecular detail. It is to develop reliable approaches for explaining how cells communicate, how tissue structures emerge and how disease alters those relationships. Better measurements must be accompanied by reproducible analysis, biological interpretation and rigorous experimental confirmation.
The scientific connection: Cells acquire their biological identities through regulated gene expression, but their behavior also depends on location. Spatial transcriptomics measures molecular activity within tissue architecture. Sequencing and microscopy produce spatially resolved datasets. Bioinformatics identifies cellular populations, expression gradients and candidate interactions. Ontologies and knowledge graphs connect these findings with established scientific knowledge. Together, these approaches create new opportunities to understand biology and advance biotechnology.
Scientific References
1. Rao A, Barkley D, França GS, Yanai I. Exploring tissue architecture using spatial transcriptomics. Nature. 2021;596:211–220. Read publication ↗
2. Williams CG et al. An introduction to spatial transcriptomics for biomedical research. Genome Medicine. 2022;14:68. Read publication ↗
3. Systematic comparison of sequencing-based spatial transcriptomic methods. Nature Methods. 2024;21:1743–1754. Read publication ↗
4. Tian L, Chen F, Macosko EZ. The expanding vistas of spatial transcriptomics. Nature Biotechnology. 2023;41:773–782. Read publication ↗
5. Spatial transcriptomics in health and disease. Peer-reviewed scientific review. Read publication ↗
6. Technical Advances and Applications of Spatial Transcriptomics. Peer-reviewed scientific review. Read publication ↗
Scientific figures are attributed to their original publications. This article is provided for scientific education and does not constitute clinical advice or a validated experimental protocol.